Engineering 100-980
Lab 4: Creating a Standalone Arduino
Contents
Materials
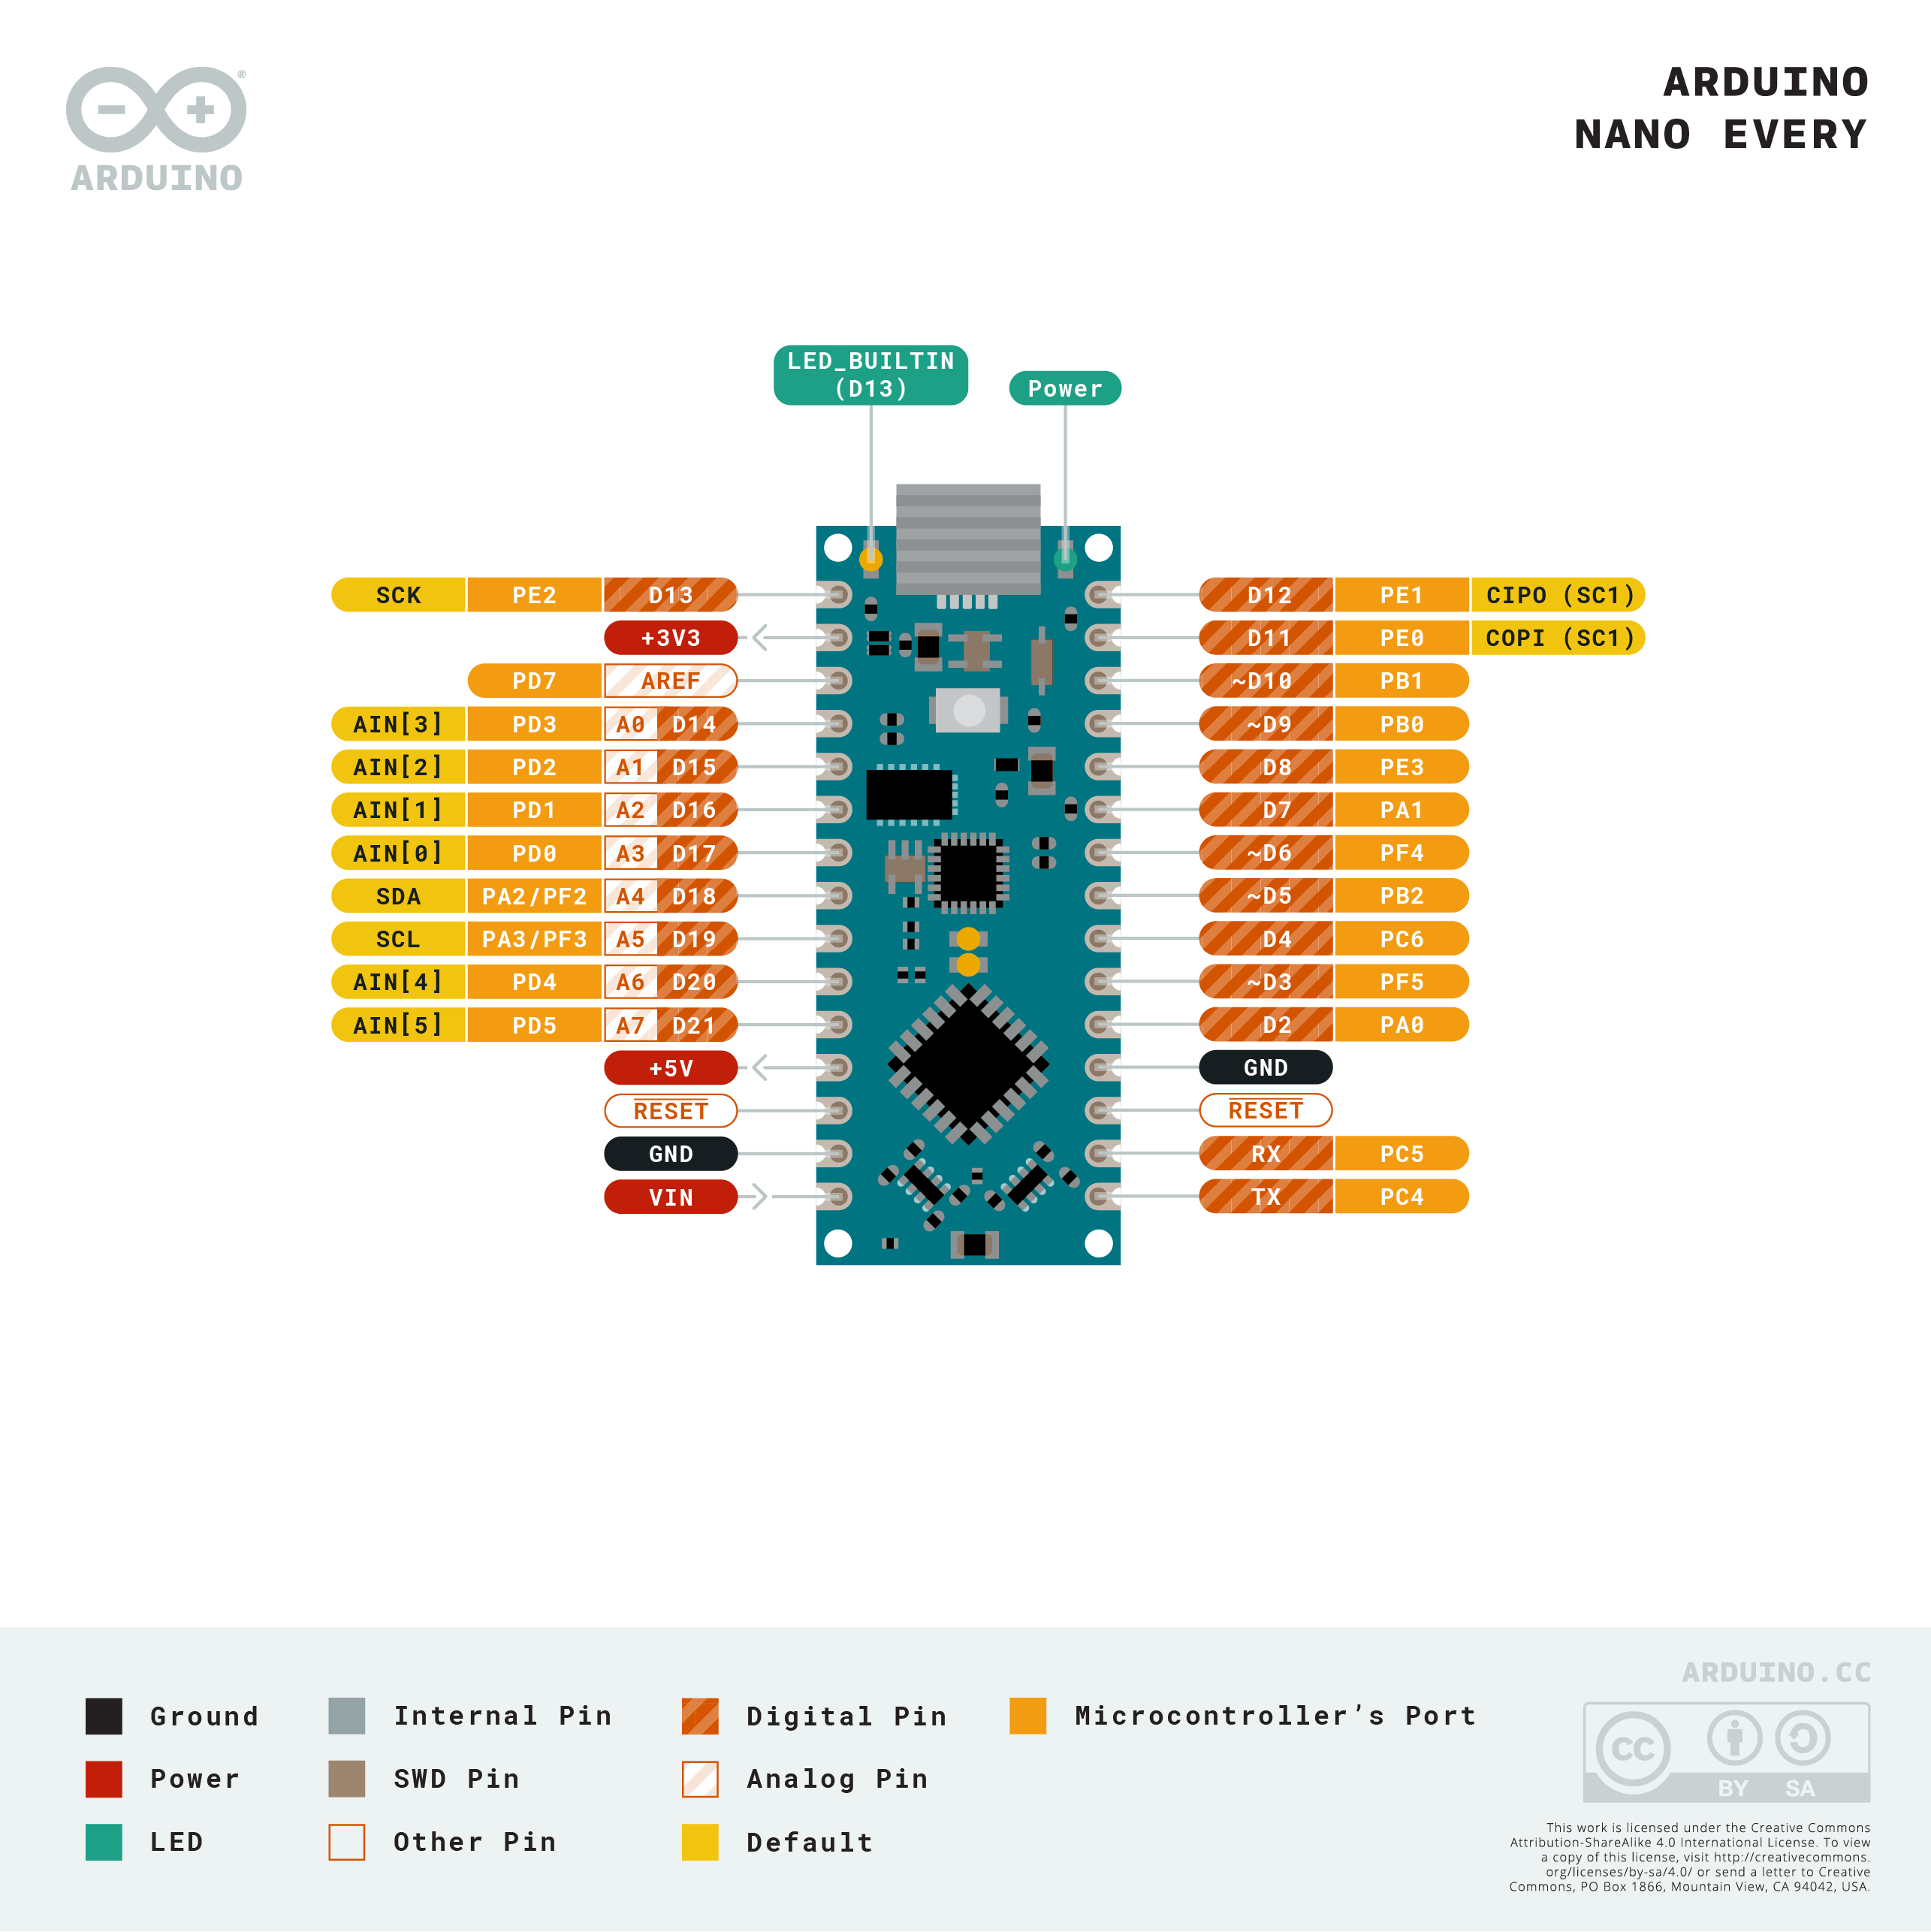
- 1 Arduino Nano Every
- 1 Breadboard
- 1 Programming Cable (and adapters if necessary)
- 1 ADXL335 Accelerometer module
- 1 MicroSD Card
- 1 Data Logger
- 1 MicroSD Card - USB Adapter
- 2 1k\(\Omega\) resistors
- 12-ish jumper wires
- 1 9V battery
- 1 9V battery connector
- A computer with the Arduino IDE installed and setup.
This is your first team lab! You can (and should) all work together to complete it and have one student submit the assignment on behalf of the team.
Remember, you are required to use proper color-coding conventions. They are listed again below for your reference.
- Red: Power (5v, 3.3v, etc.)
- Black: Ground
- Blue: Analog (Pins labeled with an A, and most likely used for analogRead or sensor data)
- Yellow: Digital (Pins labeled with a D, most likely used to control things or for more complicated sensors)
Use of vertical breadboard rails: Utilize the breadboard rails (blue and red) to run power and ground lines for easy access across the entire breadboard. For example, run a black jumper cabled from the Arduino ground pin to one of the blue rails, and then connect another black jumper from the grounded blue rail to the other blue rail. Now both blue rails are grounded, and can be used as the ground terminal for any components. Similarly, you should connect a red jumper from the 5v pin on the Arduino to one of the red rails, and use that rail for a 5v supply. In future labs, when we’re working with 5v and 3.3v, we will have you run a rail for each voltage.
Introduction
So far, every time we have used our Arduino to log data, we have read the data through Arduino’s Serial monitor, and have powered the Arduino via our computer’s USB port. While this has worked so far, our end goal is to launch these Arduinos in rockets! We cannot use a computer for power and data logging for that!
This lab can be broken down into two main sections, one in which we learn to power the board via a battery and estimate the batteries capacity or charge, and one where we record Arduino sensor data onto a microSD card. At the end of this lab, you should have all the knowledge you need to make a fully portable logger.
Arduino Power Requirements
The Arduino Nano Every that we use in this class operates at 5V logic. This means the pins coming off of it, like the digital pins, are all at 5Vs. The Arduino, however, has circuitry inside it that lets it take a range of voltages as input. This is called the Vin pin, and takes a voltage between 7-12V. The Arduino then internally converts that down to a safer 5V and 3.3V level for its own operations. For this lab, we will be powering our Arduino Nano Every with a 9V battery.
The Accelerometer
For this lab, we are using a 3-axis accelerometer. This sensor is capable of measuring acceleration in Gs on the x, y, and z planes.
1 G is considered normal acceleration that we feel on Earth as exerted by gravity. It is equivalent to a magnitude of \(9.8\,\frac{m}{s^2}\).
Data Logging
Our Arduino has some memory on it, but reading and writing to this memory is a rather complicated procedure, which is why we need the Arduino IDE to handle writing the code to the Arduino’s memory for us. Writing variables to the Arduino’s memory is not user-friendly and is difficult to read back. Therefore, we elect to instead use a microSD card, which has a far higher data capacity and allows us to easily read data on our computer. This lab will use a pre-built data logging module to write data to the microSD card in a similar way you write data out to the Arduino’s Serial monitor.
Procedure
1. Powering the Arduino
To start, we want to power our Arduino with the 9V battery. Plug your Arduino into your breadboard, and plug the 9V into it’s connection clip. It should only fit on one way, as the 9V’s two terminals are different shapes.
Notice that one wire coming out of the battery is red, and one is black. Common practice says that red will be positive, in this case +9V, and the black will be what we connect to our Arduino’s GND.
Take these wires and plug them into your Arduino via your breadboard. Red should go to the Arduino’s Vin, and black should go to any GND pin.
Once you’ve plugged the 9V in, the Arduino should light up - even though it isn’t plugged into your computer! If it does, congrats, your external power is working! If not, check your connections again.
As one last check that everything is working before we move on, upload the File → Examples → Basics → Blink code that the Arduino IDE comes with to your Arduino. After it finishes uploading, unplug your computer and verify that the onboard LED on the Arduino continues to blink on only the 9V’s power.
2. Measuring Battery Voltage
Most modern electronics, from your smartphone to even rockets, have some way of reporting back the charge of any internal batteries. While we don’t use the battery for very long at any one time in this lab, other people are using the same batteries, and so we do want to verify they are charged.
To measure battery voltage, we can use the analog pins on the Arduino, similar to how we did in lab 1. The caveat of this is, however, that the analog pins can only take up to 5V!! So, before reading the battery in, we need to build a voltage divider to step the battery voltage down to 5V max.
Using our voltage divider (see the resources page for more), we can take 2 1k resistors and step 9V down to 4.5V max. Go ahead and build this voltage divider.
When you are done, your 9V battery should have the black wire going to GND, and the red wire going to both Vin and a voltage divider.
Now, let’s test that the voltages look about right. Go to File → Examples → Basics → AnalogReadSerial and change the analogRead() function called in loop() to be the pin you plugged your voltage divider into. Run this code and make note of the values it returns.
You know on the Arduino Nano Every this value will be between 0-1024, and that your max voltage, as reported by the Arduino, is 5V. Convert your raw value to the voltage the Arduino read by dividing it by 1023 and multiplying it by 5V. This is the voltage your Arduino recorded.
Your battery, however, has a higher voltage than that. We now need to undo the effects of the voltage divider to determine the batteries original voltage. Since we used the same resistance on either side of the voltage divider, the voltage is being cut in half. Therefore, we can simply multiply the Arduino’s recorded voltage by 2 to get the 9V battery’s voltage. It should be somewhere between 8 and 10V.
3. Adding the Accelerometer
The accelerometer is relatively straightforward to wire. All of the pinouts are clearly labelled on the sensor. You will wire GND to GND, X, Y, and Z each to its own analog pin on the Arduino, and VCC to the 3V3 pin on the Arduino.
This accelerometer sensor takes 3.3V input, not 5V like everything else we have used so far. Plugging it into 5V can break the sensor or cause other bad and unintended things to happen!
To read the number of Gs coming in on each axis, we will simply read the analog input for each axis pin. X, Y, and Z all should have their own analog pins to read off of. Make the necessary changes in your code so that you can read from these pins.
We will not be calibrating the accelerometer in this lab, we will do it during the next lab. With that being said, there are a couple things to notice. Take a look at the small 3-axis figure printed on the sensor module. This shows the orientation of the sensor in relation to its outputs on the three analog pins. When the sensor is flat on the table, the Z-axis should be vertical, and the others will be parallel to the table/ground.
4. Adding the MicroSD Card Adapter Module
Unlike the other sensors and modules we have used so far, the MicroSD module we are using uses the Arduino’s digital pins. Luckily for us, there are libraries (that you should have installed when following the tutorial and initially setting up your Arduino IDE), that handle all the complicated digital interfacing for us. All we need to know is which pins to plug the adapter module into.
| MicroSD module pin | Arduino pin |
|---|---|
| CD | NC (Not connected) |
| CS | 10 |
| DI | 11 |
| DO | 12 |
| CLK | 13 |
| GND | GND |
| 3v | NC |
| 5v | 5v |
Remember to connect 5v and GND to the Arduino through the breadboard power rails. Don’t take a jumper wire and directly wire the 5v pin of the module to the 5v pin of the Arduino.
While your Arduino is powered off and disconnected from the 9V, plug your module in as shown above. The Arduino pins for this DO matter and cannot easily be changed, unlike the analog pins.
Before plugging your SD card into the module, plug it into your computer using an adapter and clear the contents of the SD card (delete all files). Make sure to clear your trash after deleting any files but before you remove the SD card. The files will remain on the card unless you do so.
Once everything is wired up, put your microSD card into the adapter module and plug in your Arduino. At this point you should modify and upload the code found in File → Examples → ENGR100-980 → Lab4-SD.
Please read through the comments of this code file, as in the next lab, you will be adding additional sensors and modifying this file on your own, without it all done for you. In this lab, you may also need to change the analog pins that are the defaults for the accelerometer and voltage divider.
There is a delay statement at the end of the loop. Think about how many data points will be taken if you take data for 5 minutes. Will you need data this often? More often? Less often? Adjust the delay accordingly.
5. Collecting Data
With everything plugged into the 9V and running, unplug the Arduino from your computer. Enjoy the portability of your new breadboard and walk around the building a little bit. Generate some acceleration by (gently) spinning the board or tapping it.
Go back to the lab and unplug the 9V now (unplug the battery and leave the wires connected to your board). Carefully remove the microSD from the adapter module, and plug it into your computer. You should see a DATALOG.CSV file. If you do not, or the file seems corrupted or very small, delete the file, plug the microSD card back in, and watch what the Serial monitor on your computer says while running the code.
Once you have a sufficiently long test (1-2 minutes) and can see that there are clear jumps in each of the axes of the acceleration in the file created, you are done with the hardware portion of this lab!
Before returning all of your equipment, make sure you save your file on your computer!! Maybe even upload it and share it with team members so you have a backup!
Then, delete the .csv file and any other .txt files off of the microSD card (you can leave any folders) so that other teams in future labs have to actually do the lab themselves, and don’t just steal your data!
6. Analyzing the Data in Google Sheets (or Excel)
Go to a new Google Sheet (sheets.new) (or Excel file), and go to File → Import → Upload and choose the DATALOG.CSV file that your Arduino created.
In the event your Arduino lost power or reset while running, you may have a header at places other than just the top of your spreadsheet. Go through and clean up any of these occurrences and delete their entire row.
Now, let’s add some columns to the spreadsheet. Right now you should have Time (ms), Voltage (Raw), X Accel (Raw), Y Accel (Raw), and Z Accel (Raw). Let’s add “Voltage (5V)” and “Voltage (9V)”.
In the first cell of each column, you will need to make a simple equation/formula to calculate the values based off of the raw sensor values the Arduino recorded.
Repeat this general process for each column, modifying the equations as needed.
Now, we need to make some graphs to analyze the data. Each graph to make is detailed in its own submission checkbox. Make sure each graph follows tech-comm best-practices and includes a title, axis labels, units, and is clearly visible. For graphs with multiple values over-layed, ensure you have added a legend.
Submission
On Canvas, you (one person on your team) will submit ONE PDF that will include all of the following:
- A plot of one of the acceleration axes versus time (pick whichever you want, just make sure it’s clearly labeled). Time should be your independent variable.
- A plot comparing 9V battery voltage to time. Time is again your independent variable.
- A screenshot of your completed data table. (You only need to submit a screenshot of whatever number of rows fits into a single image)
- A plot of all raw value variables versus time.
- An image of your fully color-coded breadboard.
Note that only one person on your team needs to submit to canvas.
To put said content into a PDF, it is suggested you create a new Google Doc (docs.new) and paste your images and write any text in the document. Export/Download this document as a PDF and upload it. DO NOT SUBMIT A GOOGLE DOC FILE OR SPREADSHEET FILES.
Submitting anything other than a single PDF may result in your work not being graded or your scores being heavily delayed.