Engineering 100-980
Lab 5: Acceleration, Pressure & Power
Starting with this lab, we will no longer plug the 9V battery straight into the Arduino’s Vin pin. Instead, the battery will power a voltage regulator circuit (built in steps 5-7), and that circuit’s 5V output will power the Arduino through its 5V pin. Until your power circuit is done, power your Arduino over USB from your computer.
Contents
- Lab 5: Acceleration, Pressure & Power
Materials
- 1 Arduino Nano Every
- 1 Breadboard
- 1 Programming Cable (and adapters if necessary)
- 1 MicroSD Card
- 1 Data Logger
- 1 MicroSD Card - USB Adapter
- 2 1k\(\Omega\) resistors
- 5-ish Black Jumper Wires
- 5-ish Red Jumper Wires
- 10-ish Other Colored Jumper Wires
- 1 9V Battery
- 1 9V Battery Connector
- 1 ADXL335 3-Axis Accelerometer
- 1 BME680 Digital Sensor
- A Computer with the Arduino IDE installed and setup.
For the power portion of the lab:
- 1 Arduino Nano
- 1 Breadboard
- 5.0V LDO
- 3.3V LDO
- 22 micro-Farad Capacitor
- Resistors for voltage divider circuit
- 9V Battery
- 1 Programming Cable (and adapters if necessary)
- A computer with the Arduino IDE installed and setup
- ENGR100-980 Arduino Library
- ENGR 100 980 KiCAD library
Safety
This lab involves working with a power supply which can provide higher voltages/currents than the Arduinos! Read the following sections carefully to maintain your safety and the safety of the components we are using.
It is very easy to accidentally short batteries when wires are connected to them. When not using the 9V battery, make sure that they have wire ends that are taped/secured, so the battery can not be shorted!
Introduction
By the end of this lab, you will have added the BME680 digital sensor from Lab 3 to your circuit from Lab 4, as well as made calibration curves for your accelerometer. You will also build a voltage regulating circuit to power your Arduino and sensors from the 9V battery, and combine it with your sensor circuit.
Most of the time involved in this lab will be adding the BME680 to your Lab 4 circuit and code, as well as working on calibrating your accelerometer.
What this means for you is that we are slowly going to start making our instructions increasingly vague. By this point you should know how to wire up an analog sensor to your Arduino and how to find and run starter code.
BME680 4-in-1 Digital Sensor
You already used the BME680 in Lab 3 as the reference for calibrating your TMP36. As a reminder, it measures temperature, humidity, pressure, and VOC gases, and its pressure data can be used to calculate your altitude since atmospheric pressure decreases with altitude.
You will be using this sensor for all sensing besides acceleration from this lab onwards so it will be important to get familiar with it.
Like the MicroSD Card Adapter Module from Lab 4, the BME680 communicates over SPI, so it connects to your Arduino in almost the same way. Since it reports measurements in physical units instead of a voltage, you will not need to calibrate it.
Accelerometer
In this lab you will continue to use the accelerometer, this time calibrating it and collecting data in Gs (or \(\frac{m}{s^2}\)).
Power Management
Power management is one of the most critical aspects of any engineering system. Without the proper voltage levels, current levels, switching speeds, and noise suppression, most systems cannot work at their maximum efficiency.
Voltage regulators are an integral part of power management and allow a constant output voltage regardless of the input voltage (with constraints). This allows a steady voltage to components that need a small margin (error) in input voltage to output accurate data.
You have actually been relying on a voltage regulator since Lab 4. When you plugged the 9V battery into Vin, a regulator built into the Arduino converted it down to the steady 5V the Arduino runs on, and your 3.3V rail came from the Arduino’s 3V3 pin. In this lab you will build that part of the circuit yourself, using two low-dropout regulators (LDOs): one that outputs 5V and one that outputs 3.3V. Their outputs become your 5V and 3.3V power rails, which power the Arduino and every sensor on your board.
Why not a voltage divider? In Lab 4 you used a voltage divider to measure your battery. A divider works well for measuring, because an analog pin draws almost no current. But a divider’s output depends on how much current is drawn from it, so if you tried to power a sensor from one, the voltage would sag as soon as the sensor turned on. A regulator constantly adjusts itself to hold its output at the same voltage, no matter how much current the circuit draws or what the input voltage is (within its limits).
Dropout voltage. A regulator can only lower a voltage, never raise it, and its input has to stay some minimum amount above its output for it to keep regulating. That minimum difference is called the dropout voltage. If the input falls below the output voltage plus the dropout voltage, the regulator can no longer hold its output steady, and the output simply follows the input downward. “Low dropout” means this difference is small, often around 1V. This matters because a battery’s voltage drops as it drains: once your 9V battery falls below 5V plus the dropout voltage, your 5V rail is no longer 5V, and neither is anything that depends on it. You will find this point for your own LDOs in step 6.
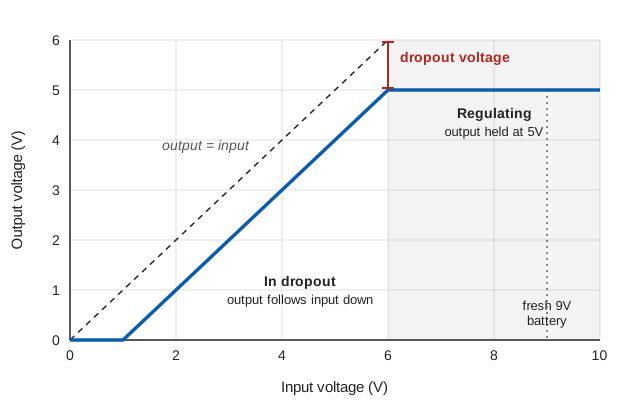
Output voltage of a 5V LDO as its input voltage changes (illustrative; the exact dropout voltage depends on your part).
Where the extra voltage goes. An LDO is a linear regulator, which means it gets rid of the extra voltage by turning it into heat. The power it wastes is
\[P = (V_{in} - V_{out}) \times I\]For example, if your board draws 50mA, the 5V LDO turns \((9V - 5V) \times 0.05A = 0.2W\) into heat. That is why LDOs can get warm, and it is one reason the 3.3V LDO in this lab takes its input from the 5V line instead of straight from the battery: it only has to drop 1.7V instead of 5.7V.
The capacitor. When you build your power circuit later in this lab, you will see a 22µF capacitor connected between the battery’s positive wire and ground, right before the 5V LDO. A capacitor stores a small amount of charge, a bit like a tiny rechargeable battery. Placed here, it acts as a reservoir right next to the regulator: when the circuit suddenly draws more current, or the battery connection is briefly noisy, the capacitor supplies or absorbs the difference. This smooths out quick dips and noise on the input, so the regulator always has a steady supply to work from.
Procedure
Due to the length of this lab, we are giving you the option to split into two groups within your team. This is not required, and if you would like to work all together, simply continue on with the lab manual. If you would like to pursue this option, split into two groups, and assign one group to be Group A (acceleration & pressure), and one group to be Group B (power), then follow the links below to the modified lab manuals.
1. Setup
As mentioned in the introduction, this lab is not going to give you nearly as detailed of instructions as previous labs have. Use your resources and refer to previous labs or references as needed if you are stuck on something!
To start, grab your assembled circuit from Lab 4. You should have a voltage divider, an accelerometer, and a MicroSD Card Adapter Module connected to your Arduino, which is powered via a 9V battery. If anything came loose, re-wire it before moving on.
Next, unplug your 9V battery and remove the jumper going into the Arduino’s Vin pin. Nothing should be plugged into Vin from now on.
Remember that the accelerometer sensor takes 3.3V input, not 5V. Plugging it into 5V can break the sensor or cause other bad and unintended things to happen!
Then hook your Arduino up to your computer. These next 2 steps will have you doing calibrations on your accelerometer, meaning we will be reading analog values over Serial. Was there a lab (maybe lab 3…) where we had start code to do exactly this that you could repurpose?
Note: Later in this lab we will ask for a picture of your finished circuit. Part of the requirements for this circuit are that one side of your breadboard’s power rail is for 5V, one is for 3.3V, and both sides should have common ground. Additionally it is required that all power is routed with red jumper cables, all ground with black, and all data with other colors.
2. Calibrating The Accelerometer
To calibrate your accelerometer, you will have to go through the same procedure that you did in lab 3, for all 3 axes of the accelerometer. This means that for each axis, you will need at least 2 known values of acceleration that you can subject the sensor to while reading the voltage.
In order to find 2 known values of acceleration, we must understand what exactly is it that the accelerometer measures. The name “accelerometer” is kind of misleading in this case, since it doesn’t actually measure total acceleration. Internally, the sensor has a tiny object (usually silicon) that is connected to the rest of the sensor via a spring-like connection. This connection has electrical properties that change based on the tension that the connection experiences. This is a simplified explanation, but the actual sensors don’t differ too much.
If a force is applied to the outside of the sensor, the tension in the connection increases to keep the small internal object accelerating at the same rate as the sensor. This means that the sensor can only detect acceleration from forces that are applied only to the outside of the package, since if a force was applied equally to the internal object, the tension in the connection would not have to increase to keep the object accelerating with the rest of the sensor. Usually this isn’t a problem, since most forces we’re concerned with are fall into this category, however, there is one major force that doesn’t: gravity. Recall from physics that gravity acts in a way that makes all objects accelerate at the same rate (\(9.8\,\frac{m}{s^2}\)). This is the exact type of force that accelerometers cannot measure, since the internal connection does not have to apply any force to the internal object to keep it accelerating with the sensor - in the absence of external forces, everything accelerates at \(9.8\,\frac{m}{s^2}\).
Now let’s try to figure out what the accelerometer would measure in 2 different situations: in free-fall, and sitting stationary on a lab table. Start by drawing a free-body diagram for each situation, and then remove the gravitational force. The acceleration from the remaining forces is what the sensor would measure. In the situation of free-fall, since gravity is the only force (in the absence of air resistance), the acclerometer measures nothing. In the situation of the sensor sitting stationary, the normal force opposes gravity and is exactly equal to the force from gravity. The accelerometer will only measure the acceleration from the normal force, and since the normal force is equal to gravity in this case, it will measure \(9.8\,\frac{m}{s^2}\), or 1 G, upwards. You will use this fact to calibrate the accelerometer.
Reminder to pay attention to the 3-axis figure printed on the sensor module. When the sensor is flat on the table, the Z-axis should be vertical, and the others will be parallel to the table/ground.
In this orientation, the Z-axis is straight up, and from our previous findings should measure 1G. X and Y are both perpendicular to the force of gravity and would be recording 0Gs. If you turn your board upside down, the Z axis should read -1G. Rotate your sensor around as needed so that each axis has at least two data-points where it is (anti-)parallel to the force of gravity.
With this calibration process completed, each axis will have a calibration value of 1G and -1G. Record these values in your spreadsheet again, and calculate the calibration curve for each axis.
Include your data table for all 3 axes, and your spreadsheet for the calibration of all 3 axes in your lab submission.
3. Connecting The BME680
As noted above, the BME680 connects to the Arduino using the same SPI pins as the MicroSD Card Adapter Module. As you learned in Lab 4, both devices share the 3 SPI data pins (11, 12, and 13), but each one needs its own chip select (CS) pin so the Arduino can choose which device it is talking to.
Wire the BME680 the same way you did in Lab 3. If you need a refresher, the sensor’s technical guide has wiring information on page 12.
The MicroSD Card Adapter Module and the BME680 should NOT connect their CS pins to the same Arduino pin. The MicroSD module uses pin 10, so if you used pin 10 for the BME680’s CS in Lab 3, move it to a different digital pin and update BMEchipSelect in your code to match.
4. Modifying The Code
Modify either your code or the code given for the previous lab to add your new sensor to the csv the Arduino outputs. You will need to modify the pins defined at the top of the file, and will need to add some column titles to the header string defined above the setup() function as well. You will also need to modify the code in loop() to include the sensor values in the string added each iteration. The new data from the BME680 will be in the physical units of the corresponding type of measurement (e.g. C for temperature), and not voltage or raw value like your analog data. Check what unit each sensor reads, and make sure it is reflected in the new column titles of your header string.
You already added the BME680 to your Lab 3 code, so use that code (or the BME680-Example sketch in the course library) as a guide for what to add to either your code or the code given for the previous lab.
Upload your code and check the Serial Monitor to make sure the BME680 is reporting sensible values before moving on. If it isn’t, double-check your wiring and CS pin.
5. Testing the LDOs
Make the circuit below on an (initially) empty breadboard. The power connection is coming from a 9V battery.
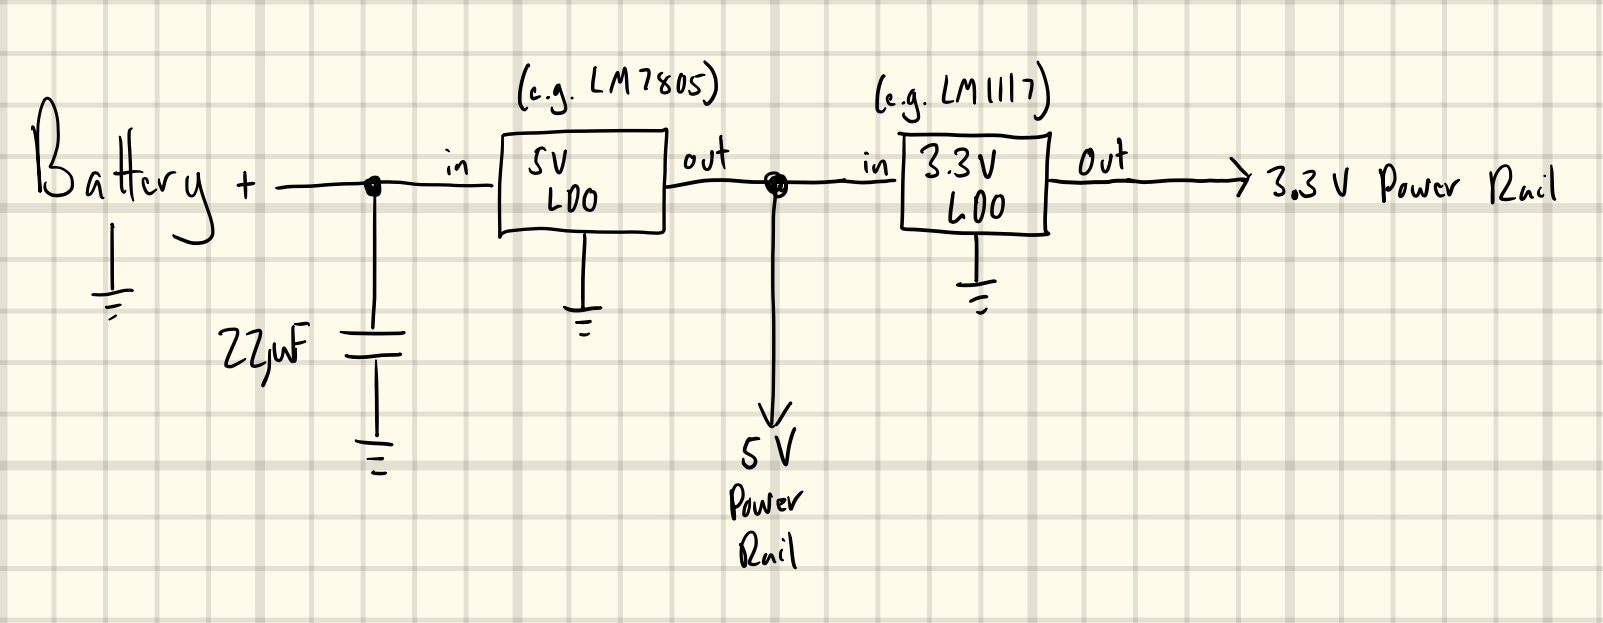
NOTE 1: We have a variety of through-hole LDOs. They may not match exactly what is specified in the diagram above. Google search for the LDOs that you have and verify their voltages and pin out configurations. It is up to you to get these right!
NOTE 2: The longer lead of the capacitor is the positive end. This means you should connect the longer lead to the side with a non-zero (non-ground) voltage, and the shorter lead to the ground line.
NOTE 3: Your system and your battery eventually need to share a common ground for you to get correct voltage measurements. Electrically connect all GND pins together to the battery’s negative terminal.
NOTE 4: We are now going to disconnect power whenever we rewire components on our breadboard!
Do NOT connect the battery to your circuit until an IA has checked it! Wiring an LDO or capacitor backwards can cause it to overheat, burst, or be destroyed. Build the circuit with the battery disconnected, then call an IA over to inspect it.
Once an IA has approved your circuit, connect the battery and use a multimeter to measure the actual outputs of the 5V and 3.3V LDO lines. If the 5V line is not exactly 5V, it can cause errors on the conversions of the sensor data from voltage into actual ”geophysical” units (C, %, g, etc.) You may want to use the reading from the 5V LDO in your calibration calculations.
A staff member will work with you on replacing the battery with a power supply.
6. Power Supply
The figure below shows a lab power supply. This is a device we frequently use in labs to power circuits: sometimes to avoid using the USB cable and a computer for power, and sometimes when we need a higher voltage than can be provided by the Arduino. There are multiple channels on the power supply, to allow for powering more than one device or produce more than one voltage at the same time.
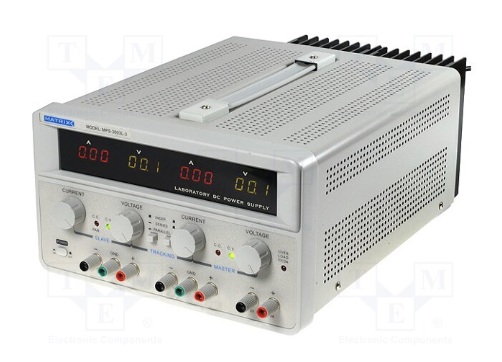
You will not be using a power supply at your workbench. Instead, bring your board to one of the IAs, who has a power supply set up for you. You will handle the power supply yourself, with the IA there to guide you. The power supply is current-limited at 500 mA and can cause serious damage if used improperly, so follow the steps below in order. Do not increase the power supply voltage above 10V.
Do not turn on the power supply until your connections have been verified by an IA!
- The IA will ask if you have read the outputs of your LDOs in the previous step. Have your readings ready; if you haven’t taken them yet, go back and do so before continuing.
- If so, disconnect the battery and wire the two terminals of the power supply to power your circuit in its place (Red = positive and Black = negative). Your two power rails are the 5V and 3.3V LDO outputs, so do not connect the power supply to a rail. Instead, plug the red wire into the same breadboard row where the battery’s positive lead was connected (the row feeding the LDO inputs), and the black wire into the row where the battery’s negative lead was connected. Do not connect them in holes adjacent to one another; we want to remove any possibility of the two wires accidentally coming in contact and shorting the circuit. Only adjust these wires while the power supply is off.
- Connect the multimeter to measure the output of the 5V LDO.
- BEFORE TURNING ON THE POWER SUPPLY, make sure all of its knobs are turned all the way to the left.
- Turn on the power supply and bring it up to 10V.
- Slowly drop the voltage of the power supply (rotate the knob slowly) until the output voltage of the 5V LDO reads more than 0.15V below its expected value (5V). Take note of this power supply voltage and label it as the 5V LDO’s value.
- Connect the multimeter to measure the output of the 3.3V LDO.
- Repeat what you did for the 5V LDO: start at the power supply voltage where you left off for the 5V LDO and keep decreasing it until the output of the 3.3V LDO reads more than 0.15V below its expected value (3.3V). Take note of this power supply voltage as well.
Turn the power supply off!
7. Battery Power
Disconnect the power supply, and add an Arduino to your power board. Make two voltage divider circuits, one hooked up to the Vin pin of the 5V LDO (i.e., this one will measure (half) the battery voltage) and one hooked up to the Vout pin of the 5V LDO (i.e., this should measure (half) 5V). Attach the output pin of the 3.3V LDO to an analog pin on the Arduino also. You should now be able to make a program that will measure the battery voltage, the 5V line voltage, and the 3.3V line voltage.
Remember to use color coding for your power lines and data lines. This will dramatically assist you in the debugging of your system if things don’t work.
Note that the output lines of the 5V and 3.3V lines are now your main power rails. The 5V LDO output line should be connected directly to the 5V line on the Arduino and there should be NO connections to the Vin pin on the Arduino. The 3.3V line does NOT get connected to the 3.3V line on the Arduino!
Once you have verified that everything is hooked up as it should be, add a 9V, battery to the top rail of your bread-board to power your LDO circuit and power on your Arduino. When you connect your battery, everything should turn on and start reporting data (although you can’t see it, since your computer is not hooked up yet). Hook up the USB to the Arduino and measure the battery voltage, 5V line voltage, and 3.3V line voltage using a program. Take a screenshot that shows that you are measuring the proper voltages on the different lines!
Take some pictures of this beautiful power board!
8. Consolidation
NOTE: We are now going to disconnect power whenever we rewire components on our breadboard!
Once you have all of your sensors working and saving data to the SD card on one breadboard, and your power system working on another breadboard, consolidate the breadboards. You should then have battery supplied 5V and 3.3V rails (with grounds), a single Arduino, an SD Card writer, and a bunch of sensors. Make sure all of your grounds are grounded to Arduino Ground. You can have all of these systems across multiple breadboards. For simplicity sake, we recommend 2 or less breadboards.
Remember that the 9V battery connects only to the input of your 5V LDO, and nothing connects to the Arduino’s Vin pin.
Take some pictures of your (nearly) complete system board!
Verify that your board runs and records data properly (including the battery voltage, 5v line, and all of your sensor data).
9. Collecting Data
With everything plugged into the 9V and running, unplug the Arduino from your computer. Walk around with your Arduino and try to think about things you can do to wildly influence the sensor values (without breaking your circuit!). More interesting changes will be more visible and easier to see in your final plots. (Question - will walking up 4 flights of stairs cause the pressure sensor to change?)
Now, before you jump ahead and start to dissemble your board, take a picture of it in its final working state! You will be submitting this!
10. Analyzing the Data in Google Sheets (or Excel)
In your spreadsheet, upload the csv file that your Arduino created. Similar to the previous lab, you will need to add some new columns to calculate values.
In addition to the columns your Arduino recorded, you will need to add these columns:
- Battery (in V)
- Acceleration in X direction (Gs)
- Acceleration in Y direction (Gs)
- Acceleration in Z direction (Gs)
- Magnitude of acceleration (Gs)
HINT: To find the magnitude of something in 2D, its \(\sqrt{x^2+y^2}\). For 3D, it is very similar…
Graph temperature and pressure on the same graph compared to time. Since the Y-axis of this graph will have 2 different units, you NEED to make sure your graph has a second Y-axis on the other side. Both graphs need to be labelled in a legend. Follow tech comm best practices when making the graph.
Graph all (4) acceleration values on the same graph compared to time. All of the values are in Gs, so only one Y-axis is needed. Be sure to label each line with a legend, and follow tech comm best practices.
Wrap-Up and Conclusion
Congratulations! You have made it through the bread-boarding portion of this class! We hope that you enjoyed your time with Arduinos and learned a thing or two.
Moving forward, you are going to learn how to make 3D CAD (computer aided design) models and how to use Altium to build our Arduino breadboard circuits on a printed circuit board that can be soldered directly onto.
All of this will give you the final skills you need for your teams to work together and assemble a package that you will build to launch on a model rocket!
Submission
On Canvas, you will submit ONE PDF that will include all of the following:
- A screenshot of your calibration spreadsheet(s) and data for the accelerometer. This should be 3 total calibration curves (1 from each axis of the accelerometer).
- Your plot comparing temperature and pressure to time.
- Your plot comparing acceleration magnitude and acceleration on each axis to time.
- A picture of your final breadboard with all the sensors connected and all of the power rail and wire color requirements satisfied.
- A short description of your power supply tests with the cutoff voltages that you found.
- A picture of your completed power board.
- A picture of your completed consolidated board.
- A (complete) system-level block diagram of your completed system. The color coding on your system-level block diagram should match the color coding on your board. You should be able to look at your picture of your board and your system-level block diagram and understand what is going on with your board. Not every line needs to be drawn though (like ground lines should NOT be on the block diagram). You may search the web to figure out what a system-level block diagram is. This submission is solely completion-based. (look at Slack channel #lab-help for more help)
- A (complete) schematic of your completed system (IN KICAD). Make sure to update your Arduino symbol to the new one in the libraries. You must use the footprints and schematic symbols we provide in the Google Drive instead of the default KiCAD ones.
- A screenshot of your (battery, 5V, and 3.3V) voltage readings from your Arduino (serial monitor) on your power board.
- Nice plots that show data from your completed board for at least 5 minutes. The data should be calibrated with plots in actual geophysical units, including time (in minutes). For simplicity, any CSV files should print voltages, and your spreadsheet should perform the conversions to geophysical units.
To put said content into a PDF, it is suggested you create a new Google Doc (docs.new) and paste your images and write any text in the document. Export/Download this document as a PDF and upload it. DO NOT SUBMIT A GOOGLE DOC FILE OR SPREADSHEET FILES.
Submitting anything other than a single PDF may result in your work not being graded or your scores being heavily delayed.