Engineering 100-980
Lab 8: Terminal Velocity and Drop Tests
Contents
Materials
- Scale (kg)
- Measuring tape / ruler
- 1 Parachute (all groups will use the same size)
- 4-5 Figurines
- Stopwatch, camera, or other timing method
- Optional: A fitness watch to track the large number of stairs you’re going to climb…
Introduction
Galileo Galilei, a 16th century astronomer, philosopher, mathematician, and central figure in the Scientific Revolution of the 17th Century, once wrote that, in the absence of resistance caused by air, a hammer and a feather would fall at the same rate. His claim was verified centuries later on the moon by the crew of Apollo 15, which is also known as the all-UMich Apollo astronaut crew. You can watch the demonstration in the video Hammer vs Feather - Physics on the moon.
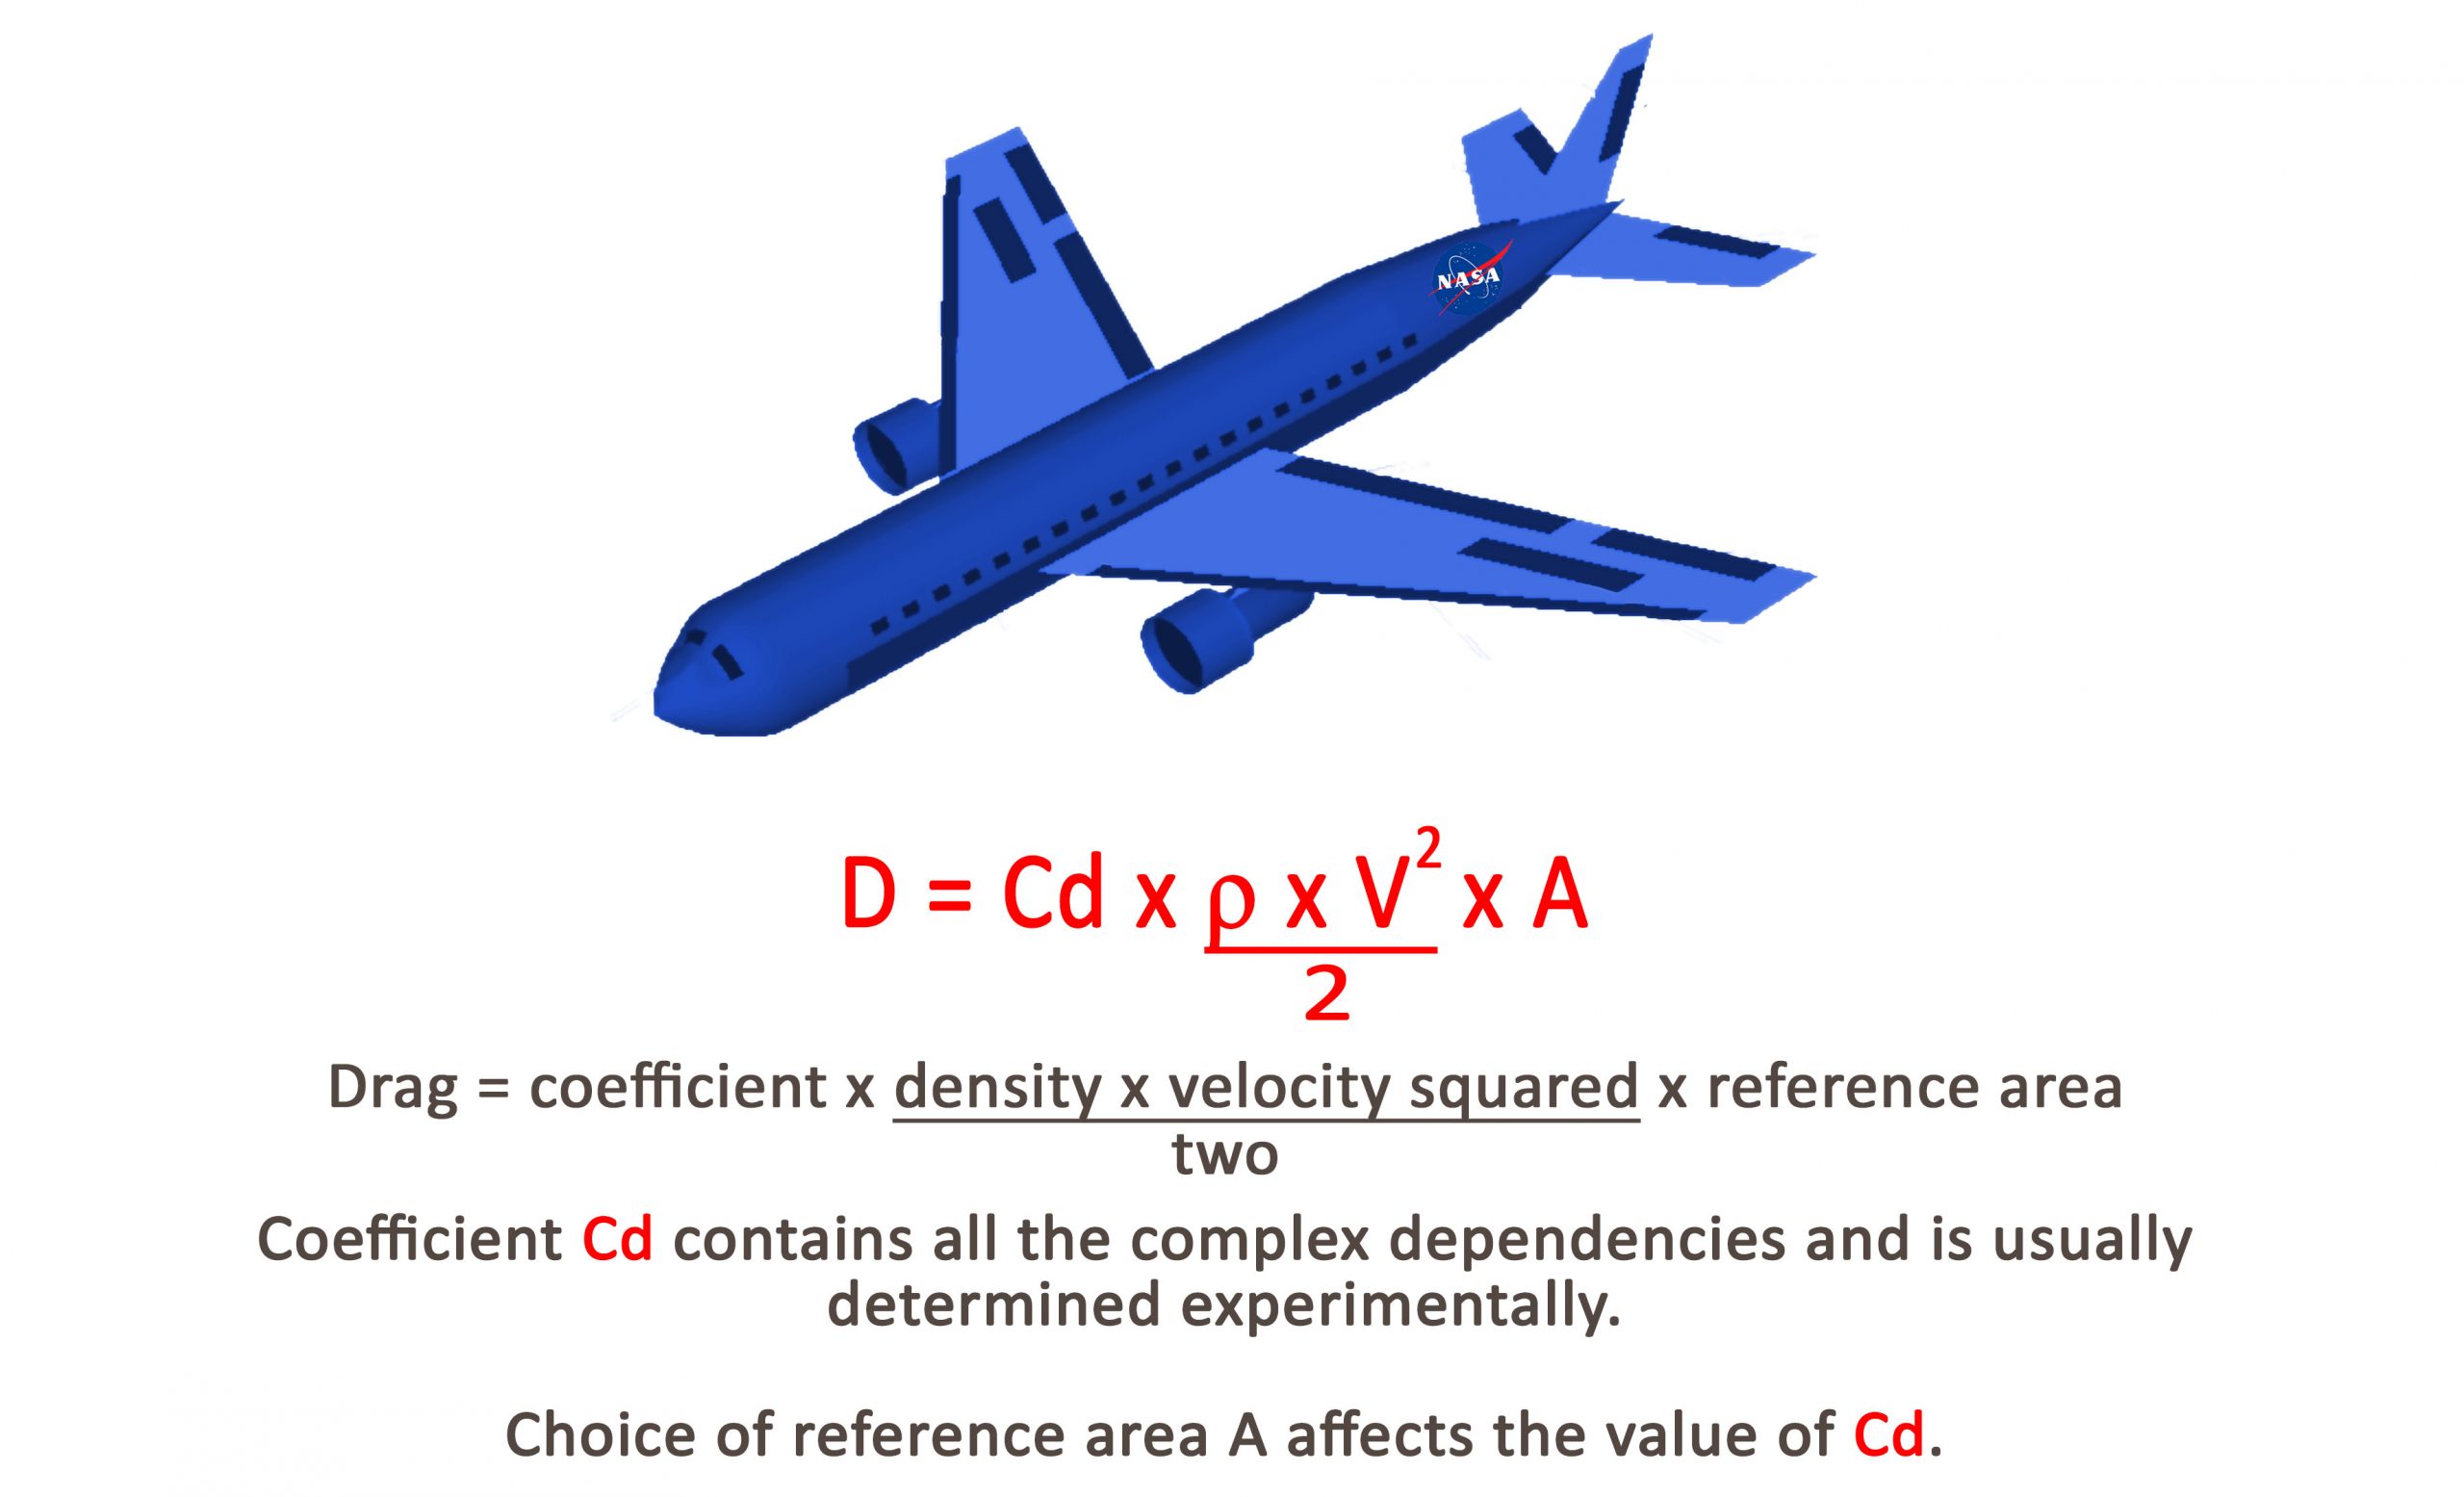
This phenomena is not random, and is instead due to drag forces. While we know that the acceleration due to gravity is constant for all objects, we also know that not all objects fall at the same rate, even if it seems they should. This is because of drag force, which is related to properties of the object as well as the cross-sectional area of the object. Terminal velocity is the maximum speed an object can reach while in free-fall. Historically, we have used this to our advantage with the use of parachutes to lead to safe fall speeds for things like payloads, or even humans.
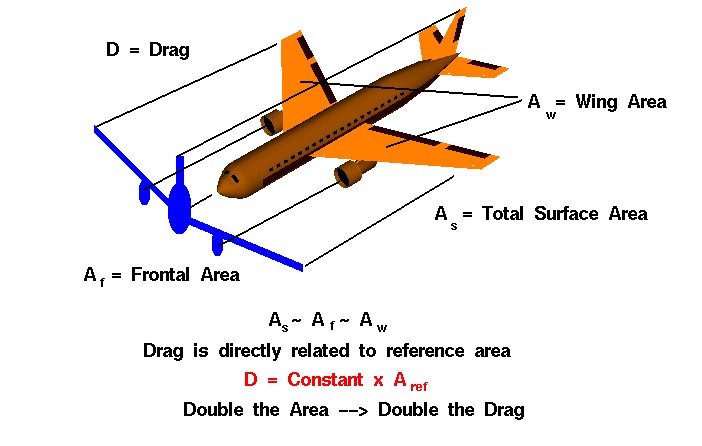
- The density mentioned is the density of the fluid the object is moving through. In the case of free-fall, it’s air’s density. The reference area is the cross-sectional area of the object with regard to its movement; in the graphic above, it’s the area as you look at the plane from the front, like this:
In the case of an object attached to a parachute, we can consider the object as a projectile with no thrust that starts from a y-position of greater than 0. We also need to incorporate drag force into our standard projectile equations to help us determine when the object will reach its terminal velocity.
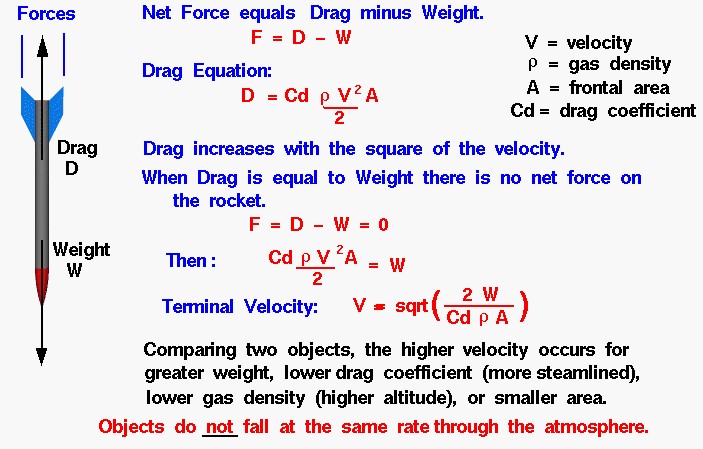
Terminal velocity is when the drag force is equal to the weight of the object, as noted below:
-
For \(C_d\), you should look up typical values for parachutes and play around with it. There will be variations, so find which coefficients get you closest to your experimental values!
-
For mass and cross-sectional area, you will measure both of these as part of your experimental setup. Since parachutes have the cross-sectional area of a circle, you can calculate the area using standard circle equations (\(A = \pi r^2\)). Keep in mind that when you measure the circle’s diameter on a flat surface, it is not the same as when it is falling and looks more like a hemisphere! Keep this in mind when doing your calculations.
- Think about the difference between a half-circumference of a sphere and the radius of the sphere. Drawing this in 2D may help.
-
The density of air is typically \(1.29~\text{kg/m}^3\).
Procedure
Setup
-
Measure the parachute’s area and record the value in the spreadsheet given below.
-
Measure the mass of the payload you are carrying for each iteration. (1, 2, 4-5 figurines).
-
Measure the mass of the parachute with one figurine attached (as given).
Parachute Trials
Note: The vertical distances are given in the Slack lab-help channel.
Before you begin collecting data, identify the exact location from which you will release the parachute. Use the measuring tape to determine the vertical distance from your release point to the top of the second-floor ceiling marker (the point described above) and from that ceiling marker to the ground. Record both distances in meters in your spreadsheet so that you can calculate the travel distances associated with each timing interval.
We are going to measure the terminal velocity of your parachute with three different mass configurations, and create plots of terminal velocity vs mass. You should create a spreadsheet to record your values in, such as total system mass, parachute area, trial numbers, time between two points (ground and some other intermediate location), experimental terminal velocity calculated as distance divided by time, and theoretical terminal velocity from the equations below.
-
Go to the Robotics building across the street. If you have three team members present, designate one as the person transporting the system back up the stairs between trials, one as the dropper, and one as the recorder. Additional members can work on the Altium lab or aid in the drop tests.
-
Prepare your parachute by flattening it out a little such that it isn’t crumpled.
-
Drop the parachute and have the partner on the ground take a video of the parachute as it falls.
-
You can look frame-by-frame to pull timestamps and record the number of seconds until the object reaches the top of the second floor and then the ground.
-
Note: The top of the second floor refers to the height of the ceiling above someone walking on the second floor.
-
-
Repeat this with 2 and 4-5 figurines attached to the parachute, recording the total masses and time differences for all trials in your spreadsheet.
Computations
-
With all of your trials completed and recorded in your spreadsheet, calculate the terminal velocity of each trial. Use the video timestamps to determine the time it takes for the parachute to travel from the top-of-second-floor height marker to the ground. Convert the corresponding travel distance to meters and compute the experimental terminal velocity as
\[v_{\text{exp}} = \frac{\Delta z}{\Delta t}\]where \(\Delta z\) is the vertical distance between the two reference points and \(\Delta t\) is the elapsed time once the system has reached steady descent. (This is simply the “distance = velocity \(\times\) time” relationship solved for velocity.)
-
For the theoretical prediction, use the drag-balance equation. When an object reaches terminal velocity, drag equals weight:
\[\tfrac{1}{2} \rho C_d A v_{\text{term}}^2 = m g.\]Solve for terminal velocity to obtain
\[v_{\text{term}} = \sqrt{\frac{2 m g}{\rho C_d A}},\]where \(m\) is the total mass of the parachute plus payload, \(A\) is the effective cross-sectional area of the parachute, \(C_d\) is the drag coefficient (use literature values for similar parachutes and refine based on your data), \(\rho\) is the density of air (\(1.29~\text{kg/m}^3\)), and \(g = 9.81~\text{m/s}^2\).
-
To estimate the altitude at which the system reaches terminal velocity, model the vertical motion with linear drag. Define \(k = \tfrac{1}{2} \rho C_d A\). The velocity and position of a falling object released from rest are
\[v(t) = \sqrt{\frac{m g}{k}}\,\tanh\!\left(\sqrt{\frac{g k}{m}}\, t\right), \qquad z(t) = z_0 - \frac{m}{k}\,\ln\!\left[\cosh\!\left(\sqrt{\frac{g k}{m}}\, t\right)\right],\]where \(z_0\) is the release height measured from the ground. Choose a criterion such as \(95\%\) of \(v_{\text{term}}\) to define “reaching” terminal velocity, solve \(v(t_{95}) = 0.95\,v_{\text{term}}\) for \(t_{95}\), and substitute into \(z(t)\) to determine the altitude at that instant. Compare this theoretical altitude to your video observations.
-
Produce two graphs with the following:
-
Plot the three experimental trials on the same graph. The y-axis will be terminal velocity and the x-axis will be mass. Be sure to label your axes clearly and include the measured parachute area in the graph title or caption.
-
Repeat this same plot again but with the theoretically determined terminal velocities for the same masses. Clearly state which drag coefficient you used and any adjustments you made while fitting theory to experiment.
-
Submission
On Canvas, you will submit ONE PDF that will include all of the following:
- Screenshots of the two plots made above.
To put said content into a PDF, it is suggested you create a new Google Doc (docs.new) and paste your images and write any text in the document. Export/Download this document as a PDF and upload it. DO NOT SUBMIT A GOOGLE DOC FILE OR SPREADSHEET FILES.
Submitting anything other than a single PDF may result in your work not being graded or your scores being heavily delayed.
Separately:
- Upload your memo as a PDF to the Memo 2 assignment on Canvas. This memo is a completely separate submission from the PDF you turn in for this lab. Take a look at the memo guidelines page for this lab for help.


